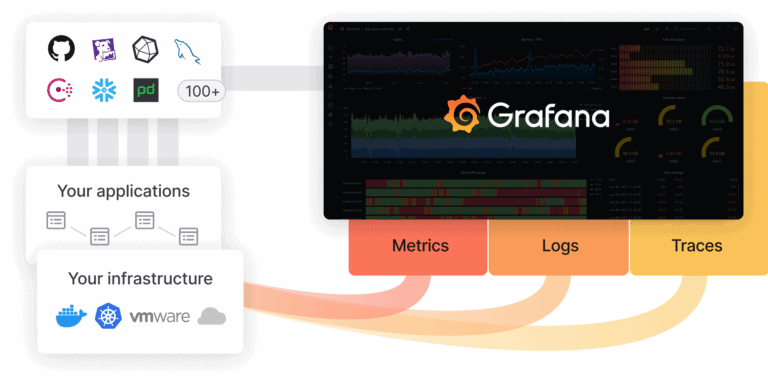
During ObservabilityCON, Grafana Labs announced updates to its commercial offerings, emphasizing its most recent open-source releases. One of the new releases was named Grafana Enterprise traces and is a self-managed tracing service that uses Tempo (an open-source project) as its basis.
It included enterprise-level features like access control and support. Another feature is ‘recorded queries,’ which allows enterprises to export the results of non-time series queries. Now, these users can construct time series data where it was not an official option before while identifying data trends that could help review processes- for instance.
Changes, additions, and updates
Because data collection is not cheap, Grafana also introduced a cardinality analysis tool that can be used for optimization, backed by new query sharing capabilities in Cloud Metrics and Grafana Enterprise Metrics that are hoped to speed up queries.
ObservabilityCON also saw the launch of the public beta preview phase for Grafana OnCall. The new tool comes from an acquisition made earlier this year, with plans to integrate it into Grafana Cloud deployments.
It promises a lot, including a unified interface to manage Prometheus, Grafana, and Altermanager alerts, create and manage on-call schedules, and a UI for configuring escalation chains.
Tempo v1.2 is here
Commercial offerings aside, Grafana Labs recently released new versions of its Loki logging system and distributed backend Tempo (now available in v1.2), providing users with an easy way to make comparisons between the current config value and the default. There is also an option to query backend blocks using the command line interface.
On top of all that, there is a command to search a time range for a key-value pair, a runtime config handler, with new capabilities to check ingesters for traces. Grafana provided an upgrade guide for users to know what’s new, changed, and more.
