More and more employees are confronted with the use of data in their daily work. That is why they need to become ‘data literate’ and have a ‘data skills set’ in order to prepare data properly, understand it and ultimately present it visually. They must, therefore, be able to ‘talk’ to data. Tools that use ‘normal questions’ or Natural Language Processing (NLP) make it even easier to make this ‘data conversation’ more natural. The Ask Data tool from visual analytics specialist Tableau is a good example of this.
Nowadays, if we have to believe any IT supplier or specialist, data is the new gold or the new oil. Apart from the value that data itself represents, data must also ensure that companies and organisations become more ‘data-driven’ and can thus innovate more.
This is only possible if the employees within these companies and organizations not only understand the value of the various generated and collected data, but also know how to value this data, interpret it and eventually visualize and present it in order to get the most out of it. This means that employees nowadays have to be more and more ‘data literate’.
Interacting with data
In concrete terms, ‘data literacy’ means the capacity of individuals to manipulate, analyse, interpret and share data. And, of course, ultimately to make decisions on the basis of all this. In short, they have to adapt themselves to a certain ‘skill set’ so that they can ‘interact’ with data ‘or ‘enter into a conversation’.
This conversation with data by individual employees is very important because this group of end-users is often the owner of the data, and they can, therefore, also assess the value of the data for their further work. In fact, it is much easier for them to ask questions about these data and find out so much more. In the end, this all has a faster and often better result than having to retrieve these data and interpretations from elsewhere, from IT departments, for example. The expertise is different in such departments and often does not provide the complete picture. It is best, therefore, if the individual employees are able to work with, understand and actually apply the data themselves, based on their own work and the associated thinking process.
The emergence of Natural Language Processing
In their conversations with data, end-users are increasingly being helped by new methods that are designed to make this process even easier. One of the methods that often crops up here is the so-called Natural Language Processing (NLP). This technology, which has been in development since the 1950s, revolves around the interactions between computers and human or ‘natural’ languages. This requires computer systems to be programmed in such a way as to process and generate large amounts of data generated by natural language.
Advantages
The added value of NLP comes from its ability to search large quantities of datasets in a very short period of time, finding results that may be similar to a human expression. As a result, data can be broken down into different sets and examined for similarities much more quickly, without employees having to use all kinds of filtering options endlessly.
By combining NLP with artificial intelligence, machine learning, even larger data sets can be analysed. In this way, when asked about the average price of a product in a certain region, a solution for data analytics knows that it must not only show the price of the product but must also indicate the region in which this price is used and that it must be an average.
Other advantages of using NLP to enter into the ‘conversation’ with data include interpreting language and solving duplicate data in datasets that provide sufficient clarity. New developments such as ‘conversational analytics’ can also be used. In short, NLP makes it possible for computer systems not only to understand what we ‘say’, but also to communicate what we possibly mean by it better.
Integration of NLP
It is, therefore, not surprising that suppliers of tools for visual data analysis capabilities integrate NLP into their products. This is also the case with the very recent acquisition of visual analytics specialist Tableau by the CRM sample company Salesforce. Earlier this year, we wrote about the platform of this specialist who has the real ‘talking to data’ by end-users as a basis for some time now.
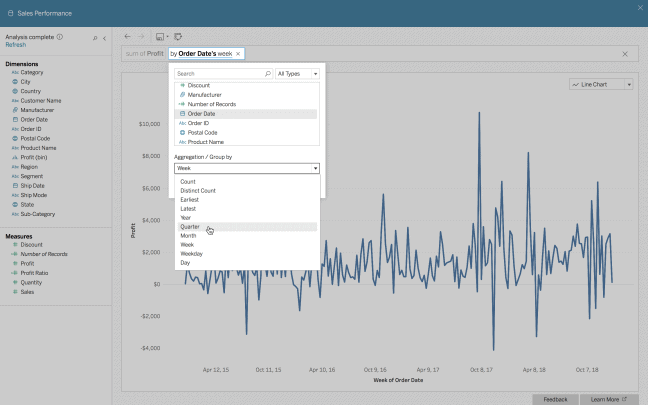
With Tableau, which is, in fact, more of an advanced interface with various connected data sources, end-users have the possibility to keep asking questions, to visualize these data and to be able to analyze them in real-time in order to arrive at new insights or decisions.
‘Asking questions’ to data
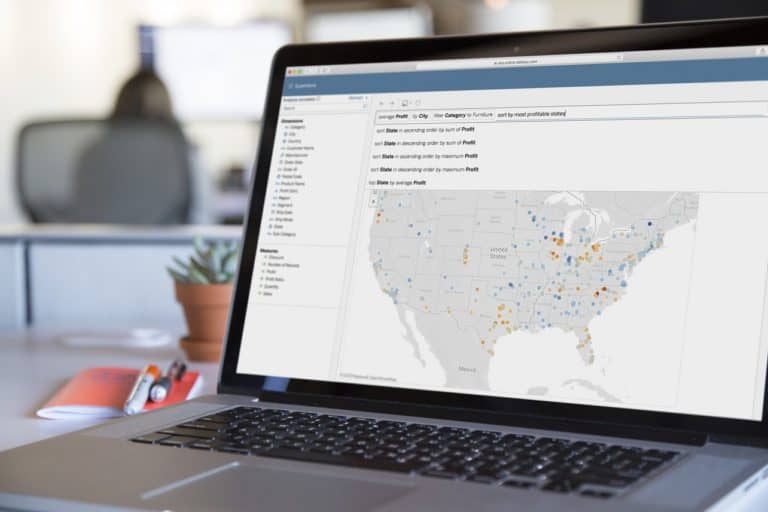
In order to be able to carry out these questions even better, the specialist added the tool ‘Ask Data’ to the platform at the beginning of this year. The tool, which has been available in a beta version since the end of 2018, is based on NLP and enables end-users to ask typed questions to the platform, now only in English. The platform provides a visualization of the requested data as an answer.
Users can use this to further investigate the data by further sharpening the question and asking for more details. To do this, they do not need any further in-depth knowledge of the structure of the data to be searched or programmed, but all the functionality of the Tableau platform then helps them further.
Ask Data: under the hood
When we take a closer look at the advanced NLP algorithms under the hood of Ask Data, they are entirely focused on the intention of the end-users and not on keywords. For example, data sources are automatically profiled and indexed, so that the software exactly knows what someone means when they type something into a question. Statistical knowledge is coupled with contextual knowledge of real-life concepts.
Moreover, the Ask Data algorithms recognise synonyms, which gives us even sharper insights. To give an example: in addition to the word ‘sell’, words such as profit, income or merit can also be added to the question at the same time, so that the tool ‘knows’ what information it has to present.
Combination with previously used activities
Furthermore, the tool is also prepared for more ambiguous or vague language that ensures that asked questions can be interpreted in multiple ways. This is one of the tricky issues for NLP. When this is the case, the Tableau tool combines the information from the data source used with previous usage activity – for example, previously asked questions to this specific data – and then automatically provides a number of recommendations for useful added search options. End users can then add these to their question so that they eventually get even more specified information. It goes without saying that all data sources supported by Tableau can be used for this purpose.
The tool ultimately ensures that users can eventually select the right forms to present the found data visually, based on best practices. For financial data, this can be, for example, a certain chart in which negative figures are automatically highlighted in red or geographical information is projected on a map.
Further extensions to Ask Data functionality
In the course of this year, the capacities of Tableau’s NLP tool were further expanded. For example, it is now possible to have calculations carried out automatically on the basis of typed commands. Furthermore, a new user interface ensures that end users have even better ‘conversation experiences’ when they go deeper into their data.
During the Tableau user conference it was recently announced that Ask Data could also be integrated into internal portal environments or wikis of companies and organisations, so that more and more employees can ask questions to the company data, visualise it and share it.
In addition, new features for Tableau are now being developed that seem to be based on the Ask Data functionality. With the Explain Data functionality, which is currently in a beta phase, end-users should soon be able to ‘ask’ the explanation behind unexpected results that emerge from the analysed data. By using artificial intelligence, the tool searches for the right answers in hundreds of statistical explanations. These statements are displayed visually and can be searched further with the full functionality of Tableau. According to the supplier, this enables users to discover unexpected insights more quickly and to obtain explanations for this more easily.
NLP functionality is an interesting development
In summary, we note that with the arrival of NLP, it will become increasingly easy for end-users to actually ‘talk’ with their data. This makes the conversation more intuitive and natural. This, in turn, means that the threshold for communicating with data will be lowered and more and more employees will be able to gain relevant insights based on data.
The advent of tools such as Ask Data will also make these kinds of self-service data tools even easier to use for every employee. This increases the ‘data literacy’ and allows companies and organisations to become ‘data-driven’ more quickly and easily.
In this way, the advent of more intelligent interaction with data obviously cuts both ways; faster insights and more expertise for users. We are therefore curious about the possibilities for this interaction with data, including the use of NLP and of course artificial intelligence, that will occur in the (near) future.