Tag: Data visualization

Here you will find all the articles with the tag: Data visualization.

Grafana celebrates 10-year anniversary with version 10

Grafana celebrates 10-year anniversary with version 10

Grafana Labs is releasing Grafana v10. It's also looking back this week on the 10th anniversary of the open-source data visualization platform. At the internationally organized GrafanaCON today, creator Torkel Ödegaard will present a keynote. In the press release, Grafana explains why it came i... Read more

date11 months ago
Belgium-based Cumul.io raises €10 million for low-code analytics

Belgium-based Cumul.io raises €10 million for low-code analytics

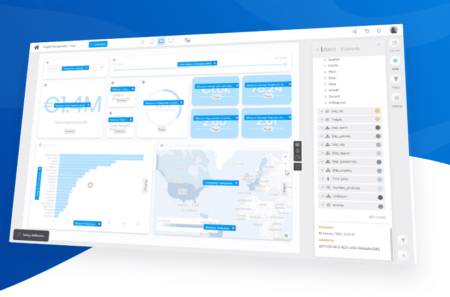
Cumul.io has secured €10 million in venture capital to hire staff and expand into new markets. The Belgium-based firm develops a low-code platform for analytics and data visualization. The investment brings Cumul.io's total funding to €13.1 million. The round was led by French venture capit... Read more

date1 year ago
Tableau’s latest updates make onboarding users easier

Tableau’s latest updates make onboarding users easier

The latest enhancements to Salesforce's data visualization platform also help users build better dashboards. Salesforce's Tableau Software is introducing a major update that aims to help customers unlock more data insights, the company announced. The updates will also help users build better das... Read more

date2 years ago
AWS updates QuickSight with additional visualization features

AWS updates QuickSight with additional visualization features

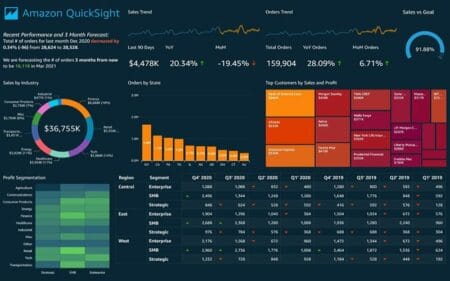
AWS added Fine-Grained Visual Embedding to QuickSight, a business intelligence service. The functionality allows visualizations to be integrated into web pages and applications more easily. Amazon QuickSight is a cloud-based serverless business intelligence solution. AWS designs the solution to ... Read more

date2 years ago
Tableau 2020.1 announced, includes animated visualisations

Tableau 2020.1 announced, includes animated visualisations

The new version of Tableau recently announced has a number of new features, including visualisation animations, dynamic parameters and a number of new management capabilities. The updates should provide users with deeper insights into their data. In Tableau 2020.1, the company adds a number of n... Read more

date4 years ago
Tableau wants to make analytics understandable for everyone

Tableau wants to make analytics understandable for everyone

For the twelfth edition of the Tableau Conference (TC19), 20,000 data enthusiasts travelled to Las Vegas in mid-November to emerge themselves in data visualisation for three days. The central message: data makes the world a better place, as long as data tells the story well. NLP and Machine Learnin... Read more

date4 years ago
Tableau and GigaSpaces join hands

Tableau and GigaSpaces join hands

GigaSpaces has partnered with Tableau for machine learning and data visualization. The solution that must result from the collaboration accelerates personalized Business Intelligence (BI) visualizations for improved insights and data analysis. GigaSpaces, the creators of real-time analytics plat... Read more

date5 years ago
Tableau lets you communicate with your data in-depth

Tableau lets you communicate with your data in-depth

Big data is increasingly playing a role within companies to support operational processes. But how can employees visualize this complex mess of data in a clear and simple way in order to draw conclusions from it? Tableau provides a tool that makes this possible. All the more reason to enter into a ... Read more

date5 years ago