
Microsoft is giving administrators more insight into data traffic within cloud environments with an update to measurement and logging functionality for Azure Firewall. Especially when it comes to slowing traffic or anomalous behavior.
The Azure Firewall sits between the application server and the end user and monitors application traffic. The tool also ensures that security policies are actually implemented.
Addition of various functionality
The update to this firewall environment now adds Latency Probe metric functionality, Flow Trace logs and Top Flows logs. These functionalities are mainly to enhance the Azure Firewall as-a-service capability to alert system administrators why the performance levels of their Azure environment are fluctuating.
For this purpose, the various functionality now added provides more visibility and insights into the data traffic processed by the firewall with metrics and logs. The speed of network traffic is often a good indicator of how healthy a network is.
Operation
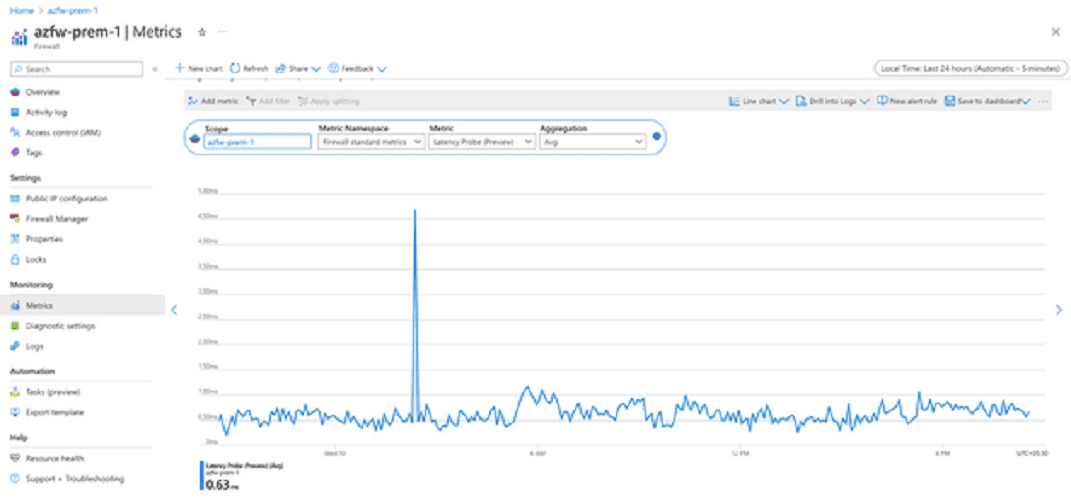
Among other things, the Latency Probe data measures the average latency of a firewall and not the end-to-end latency of individual packets. The cause of this latency can then be sought, for example, in high CPU usage, traffic throughput and network problems.
The Flow Trace log functionality helps detect asymmetric routes of network traffic that may be causing problems or packets dropping. Administrators can look at these network logs and use the tool to verify problems such as asymmetric routes.
With the Top Flows functionality, administrators can find out what is causing the largest bandwidth issues in the firewall. These logs identify the top traffic flows going through the firewall and traffic-relating anomalies. Administrators can then use this to determine whether to allow this traffic or not.
Also read: Microsoft introduces Azure AIOps services for telecom operators