
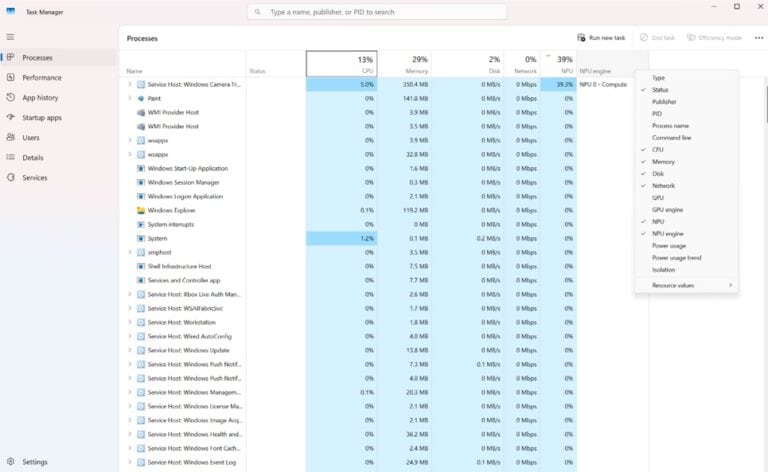
Microsoft is expanding Task Manager in Windows to provide insight into AI workloads. On newer devices, the Processes tab shows, for each process, how much load is placed on the NPU and the GPU’s neural engine. The Performance tab displays total usage in a graph.
Until now, Task Manager displayed CPU, memory, disk, network, and the standard GPU, but not the neural processing unit. That blind spot is now gone. Microsoft is adding columns for NPU, NPU engine, GPU, and GPU engine, which users can enable themselves by right-clicking on the column headers.
On the Details tab, two additional columns are added: Dedicated NPU Memory and Shared NPU Memory. These show which memory pool an AI task is drawing from. If shared memory usage increases, dedicated memory fills up, and memory is then allocated from system memory. This comes at the expense of performance. For integrated NPUs, the dedicated memory column remains empty, since such a chip does not have its own pool.
Fallback to the CPU becomes visible
The main benefit lies in detecting silent fallbacks. Anyone building a model with ONNX Runtime or DirectML targets a specific execution provider. If the data type is incorrect or a driver is missing, the framework silently shifts the computation to the CPU to prevent a crash. This is now visible in Task Manager: if the NPU column stays at 0 percent while CPU usage increases, the model isn’t running where it should.
In addition to the standalone NPU, there’s the GPU neural engine: matrix accelerators built into the graphics chip itself. Both perform AI calculations more efficiently than a standard GPU, but appear as separate labels.